This documentation shows how to install, configure, and use the Candles_Painter cTrader indicator in real trading workflows. You’ll learn how to pick the right Higher Timeframe, tune lookback and opacity for a clean chart, enable/disable bar painting, and optionally add HTF High/Low lines. Each section includes step-by-step actions (what to click and what to set) plus screenshot checklists, best-practice presets, and troubleshooting for common setup issues.
Candles Painter is a Store indicator and is used on cTrader Desktop (Windows/Mac).
Open the Candles_Painter product page in cTrader Store and click Install.
If you have Cloud synchronisation enabled, the indicator becomes available in your desktop cTrader automatically.
If Cloud synchronisation is disabled, download the indicator and double-click the .algo file to open it in cTrader Desktop.
First Launch (adding to a chart)
You can attach the indicator from the chart toolbar or context menu.
Open cTrader Desktop and load any instrument chart (e.g., EURUSD).
Click the Indicators icon on the chart toolbar.
Search for Candles Painter and select it.
Review parameters in the settings window and click Add / + Add to Chart.
Step-by-Step Setup Guide
Step 1 — Select your Higher Timeframe (HTF)
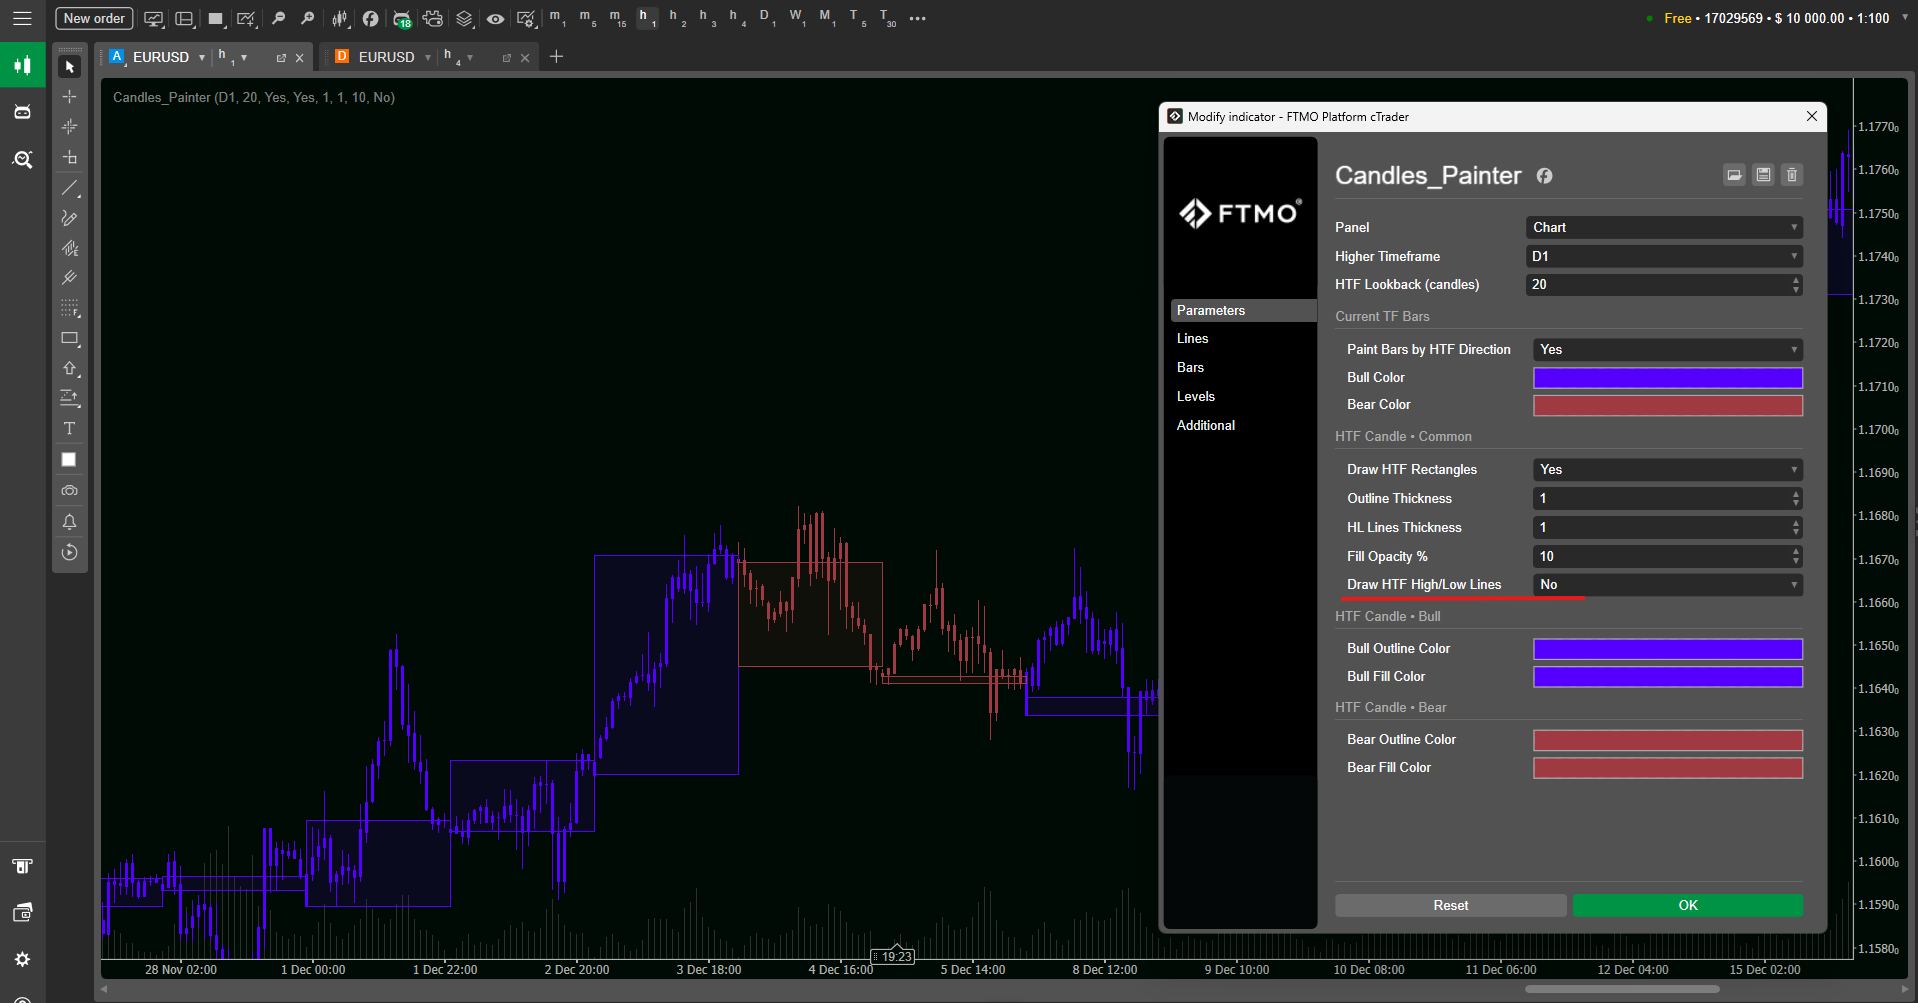
Open the Candles Painter settings panel (after selecting the indicator).
Find Higher Timeframe.
Set it to your desired HTF (example: H4 for a strong intraday bias layer).
Click Add / Apply.
Step 2 — Control how much history is shown (Lookback)
In the “Core” section, locate HTF Lookback (candles).
Set a value such as 20 (default shown) for a clean recent view, or higher if you’re studying history.
Apply changes and confirm the number of visible HTF rectangles on the chart updates.
Step 3 — Enable/disable bar painting (Current TF Bars)
Go to the Current TF Bars section.
Set Paint Bars by HTF Direction to Yes to color your execution candles by HTF bias.
Choose Bull Color and Bear Color that are easy to distinguish.
Apply and confirm that all LTF candles inside the same HTF candle share the same bull/bear coloring.
Step 4 — Configure HTF body rectangles (clean overlay)
Open HTF Candle • Common.
Set Draw HTF Rectangles to Yes.
Set Fill Opacity % (example: 10) to keep price visible.
Adjust Outline Thickness so rectangles remain readable at your zoom level.
In HTF Candle • Bull and HTF Candle • Bear, choose outline/fill colors.
Step 5 — Enable HTF High/Low lines (optional)
In HTF Candle • Common, set Draw HTF High/Low Lines to Yes.
Set HL Lines Thickness] to a readable value (example: 1 – 3, depending on your chart scale).
Apply and confirm two horizontal lines (High and Low) appear per HTF candle.
Parameters Explained
Higher Timeframe
What it does: selects which candle “controls” bias painting and rectangle/HL rendering.
Examples:
If you trade M5, set HTF to H1 or H4 for intraday structure.
If you trade H1, set HTF to H4 or D1 for swing context.
What changes when you adjust it: the candle boundaries on your chart shift, and bar coloring / rectangles update to match the new HTF segmentation.
HTF Lookback (candles)
What it does: limits how many historical HTF candles are drawn. Examples:
20: clean and focused (default shown).
50 – 100: better for back-review, more objects on screen.
What changes when you adjust it: more/less HTF rectangles and lines appear in history; higher values may add visual density.
Paint Bars by HTF Direction
What it does: when enabled, recolors your current timeframe candles based on the HTF candle’s bullish/bearish direction. Example: In an HTF bullish candle, even LTF pullbacks will still appear in your “bull” color—because the intent is to show HTF bias, not LTF micro-swings.
Bull Color / Bear Color
What it does: sets the colors used for painted LTF bars. What changes when you adjust it: only the current timeframe candle colors change (if bar painting is enabled).
Draw HTF Rectangles
What it does: enables/disables the HTF body overlay rectangles. What changes when you adjust it: the open-to-close overlay disappears/appears, while bar painting can remain active independently.
Outline Thickness
What it does: sets how “strong” the HTF body boundary is. Tip: Increase it slightly if you trade on very bright charts or if you zoom out often.
Fill Opacity %
What it does: sets transparency of the HTF body rectangle fill. Examples:
5 – 15: subtle overlay (recommended for most).
20 – 35: stronger context emphasis.
Draw HTF High/Low Lines + HL Lines Thickness
What it does: shows HTF candle extremes and sets their visibility strength. Best use: when you specifically care about HTF range breaks, HTF sweeps, or “acceptance” beyond the HTF high/low.
How to Use - Practical Workflows
Workflow 1 — HTF bias filter for LTF entries
Goal: only take lower-timeframe setups in the direction of the higher timeframe candle.
Set Higher Timeframe to H4 (example).
Enable Paint Bars by HTF Direction = Yes.
Keep Draw HTF Rectangles enabled with low opacity (e.g., 10).
Trading rule example:
If the chart is currently painted with Bull Color], only execute long setups on your LTF trigger.
If painted with Bear Color, only execute short setups.
Workflow 2 — Range awareness using HTF High/Low lines
Goal: use HTF extremes as context for breaks, rejections, or liquidity sweeps.
Enable Draw HTF High/Low Lines = Yes.
Increase HL Lines Thickness until the lines remain visible at your usual zoom.
Mark reactions: watch how LTF price behaves when approaching HTF High or HTF Low.
Optional: keep rectangles ON to see whether price is in the HTF body area or near extremes.
Workflow 3 — Clean SMC/Wyckoff context overlay
Goal: keep execution chart uncluttered while still seeing the higher-timeframe candle “structure”.
Set Higher Timeframe to D1 (example for intraday trading).
Set Fill Opacity % to 5 – 12.
Disable High/Low lines if you prefer minimal visuals: Draw HTF High/Low Lines = No.
Keep bar painting enabled so you always know the daily candle bias while executing on M15/M5.
Workflow 4 — Session scalping with H1 overlay on M1/M5
Goal: keep fast execution but avoid fighting the larger candle direction.
On M1 or M5, set Higher Timeframe to H1.
Set HTF Lookback (candles) to 10 – 30 so the chart stays clean.
Enable bar painting and rectangles; keep opacity low.
If you see frequent flips between bull/bear HTF candles, reduce noise by choosing a slightly higher HTF (e.g., H4).
Best Practices & Settings
Pick an HTF that meaningfully guides decisions: usually 1–3 timeframe steps above your execution chart.
Keep opacity low so price remains readable (many traders prefer the default light feel).
Use lookback intentionally: smaller for live trading focus; larger for study/review.
If your chart already has many drawings/levels, disable High/Low lines first to reduce clutter, then decide if you need them.
Choose bull/bear colors that remain readable in both light and dark chart themes.
A simple “pro” layout: HTF rectangles ON (very subtle), bar painting ON (clear), High/Low lines ON only when you’re actively trading range breaks.
Troubleshooting
“I installed it, but I can’t find it in indicators.”
Confirm you’re on cTrader Desktop (Windows/Mac). Store indicators are for desktop.
If Cloud sync is OFF, ensure you opened the indicator’s .algo file with cTrader Desktop.
Use the indicator search (toolbar Indicators icon) and type Candles Painter.
“Rectangles/lines don’t show on the chart.”
Make sure Draw HTF Rectangles is Yes.
If rectangles are too subtle, increase Fill Opacity % slightly.
Ensure HTF Lookback (candles) is not set too low (e.g., 1 – 2 ).
Enable Draw HTF High/Low Lines if you expect to see range lines.
“My chart looks too busy now.”
Reduce HTF Lookback (candles) (try 10 – 20).
Disable Draw HTF High/Low Lines first.
Lower Fill Opacity % and reduce Outline Thickness.
Tips & Tricks
Use boundary awareness: zoom in enough to see where one HTF candle ends and the next begins—this often explains “sudden” behavior changes on the LTF.
If you trade multiple sessions, save chart templates: one with HTF High/Low lines ON (breakout focus) and one OFF (trend/pullback focus).
When sharing screenshots or journaling, keep rectangles ON and opacity slightly higher—it makes your HTF thesis obvious in reviews.
Bar painting shows HTF candle direction, not a buy/sell signal. Don’t treat color flips as entries—use your own trigger and risk rules.