Getting Started
Installation (cTrader Store)
Open cTrader Desktop.
Go to Store → Indicators.
Search for Side Volume Profile.
Click Install.
Restart cTrader if prompted.


First Launch
Open any chart (e.g., EURUSD or XAUUSD).
In the chart, click Indicators.
Select Side Volume Profile and click Add.
In the parameter window, keep defaults and click OK.


Step-by-Step Setup Guide
Step 1 — Choose the Range Mode
Open indicator settings (gear icon / indicator list → Side Volume Profile → Settings).
Find Range Mode.
Set to:
AutoByTimeframe for adaptive behavior, or
FixedBars for consistent backtesting/replication.
If using FixedBars, set Fixed Bars Count (example: 200–500).


Step 2 — Set Profile Resolution (Rows/Bins)
Locate Rows (Bins).
Start with:
48–72 rows for intraday charts
72–120 rows for larger ranges
Click OK and confirm the profile looks detailed but not “noisy.”


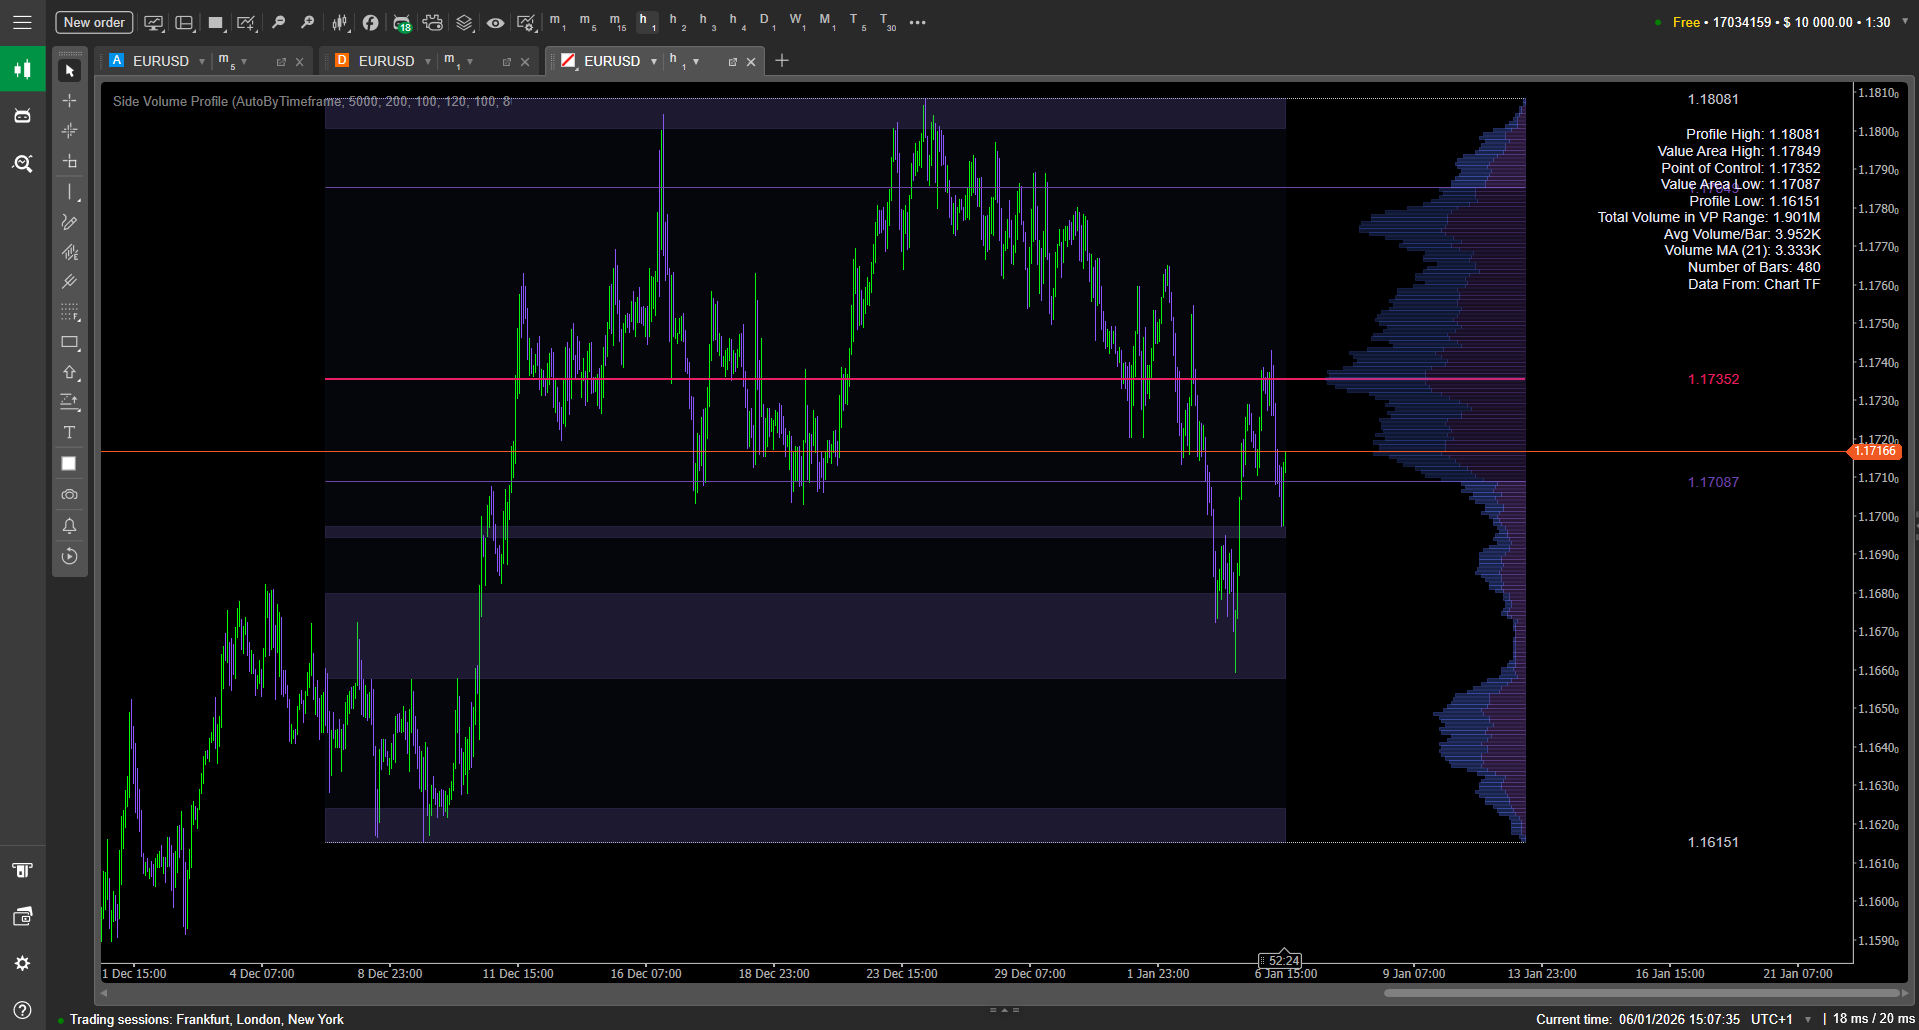
Step 3 — Configure Key Levels (POC/VAH/VAL/High/Low)
In settings, find the VA & Levels section.
Set Value Area % to 70 (common baseline).
Enable: Show POC, Show VAH,Show VAL.
Enable Profile High/Low if you want range bounds on-chart.
Increase POC line width by 1–2 steps to make it visually dominant.

Step 4 — Turn On LVZ (Low-Volume Zones)
Locate Low-Volume Zones.
Enable LVZ highlighting (if there is a toggle).
Set LVZ Threshold to 10–20% of max row volume.
Set Minimum Height (Rows) to 2–4 to filter tiny gaps.
Apply and look for clean “gaps” that stand out without repainting the whole profile.


Step 5 — Add Top Volume EMA Overlay (Optional)
Find Top Volume settings.
Set EMA Period to 14 or 20.
Set Height % to 10–20%.
Keep Offset (Pips) at 10 initially (adjust if it overlaps candles).


Parameters Explained
Range Mode
AutoByTimeframe: the profiled range is determined automatically based on the timeframe.
What changes when you switch TF: the profile “context window” changes with it, so POC/VA levels may shift accordingly.
FixedBars: profiles exactly N bars.
What changes when you increase N: broader context, slower-changing POC, wider value area.
What changes when you decrease N: more reactive profile, better for short-term scalps.
Rows (Bins)
Higher rows = smoother, more granular profile (but can look busy).
Lower rows = simpler profile (but can hide micro-structure).
If VAH/VAL look “stair-stepped,” increase Rows by ~15–25%.
Profile Width / Width Scale / Right Offset
Width controls readability.
Right Offset prevents overlap with candles and keeps the last bar readable.
If you trade off candle patterns near the right edge, increase Right Offset slightly so the profile never touches the last 2–3 candles.
Bin Thickness, Opacity, Label Gap
Thickness: helps on high-resolution monitors.
Opacity: helps integrate the profile with your chart background.
Label Gap: improves readability when you have many objects on the right side.
Value Area %
Typical: 68–70%.
Higher VA% (e.g., 75–80) creates wider value boundaries → fewer “edge” signals.
Lower VA% (e.g., 60–65) creates tighter value boundaries → more frequent touches/levels.
VAH/POC/VAL toggles + line styles
Use thicker POC to signal the “fair price” magnet.
Use thinner VAH/VAL to keep them readable but secondary.
Profile High/Low
Useful as range boundaries for targets and invalidation.
If you already draw range boxes manually, you may keep these off to reduce clutter.
LVZ Threshold + Minimum Height
Threshold too high → too many zones (noise).
Threshold too low → only extreme gaps appear.
Minimum height filters tiny one-row gaps that don’t matter.
Top Volume EMA (Period / Height / Offset)
Lower EMA period reacts faster but can be choppy.
Height is purely visual.
Offset keeps the overlay from colliding with candles (default offset referenced as 10 pips).
Palette / Custom Colors / Stats Panel
Use a high-contrast theme if you trade quickly.
Use custom colors if you have a strict template.
Stats panel is best for quick number checks; turn it off for clean screenshots.
How to Use - Practical Workflows
Workflow 1 — Value Reversion (POC Magnet Trade)
Goal: trade back toward “fair value” after an extension.
Set Range Mode to FixedBars and Bars to 500.
Enable POC, VAH, VAL.
Wait for price to move outside value (above VAH or below VAL).
Look for slowing momentum and acceptance back toward value.
Use POC as the primary target and the opposite value edge as a stretch target.


Workflow 2 — Value Edge Reaction (VAH/VAL as Decision Points)
Set Value Area % to 70.
Keep Range stable (FixedBars recommended).
When price approaches VAH/VAL, watch whether it rejects (wick + close away) or accepts (multiple closes through).
If rejection: trade toward POC. If acceptance: treat the broken edge as a new “held” level and trade continuation.
Short Example


Long example


Workflow 3 — LVZ Break & Retest (Fast Zone Continuation)
Enable LVZ and set threshold to 15%.
Identify a clear LVZ gap between two higher-volume shelves.
When price breaks through the LVZ, wait for a retest into the gap.
Enter on the retest rejection, targeting the next high-volume shelf (often near VAH/VAL or a visible bulge).


Best Practices & Settings
Recommended Baselines (Good Starting Points)
Intraday (M5–M15): FixedBars 200–400, Rows 60–90, VA% 70
Swing (H1–H4): FixedBars 300–800, Rows 72–120, VA% 68–70
LVZ: Threshold 10–20%, Min Height 2–4
Visual Hygiene
Keep POC thick, keep VAH/VAL medium, and keep High/Low thin. This creates a clear hierarchy so your eye snaps to the right thing first.
Troubleshooting
The profile overlaps my candles
Increase Right Offset.
Reduce Profile Width or Width Scale.
The profile looks too “blocky”
Increase Rows (Bins).
Reduce Bin Thickness if the chart becomes too dense.
Too many LVZ highlights (everything is colored)
Lower LVZ sensitivity by reducing the threshold effect (try 10–15%).
Increase Minimum Height (Rows) to 3–5.
VAH/VAL feel “too wide” or “too narrow”
Adjust Value Area %: lower = narrower, higher = wider.
