Overview
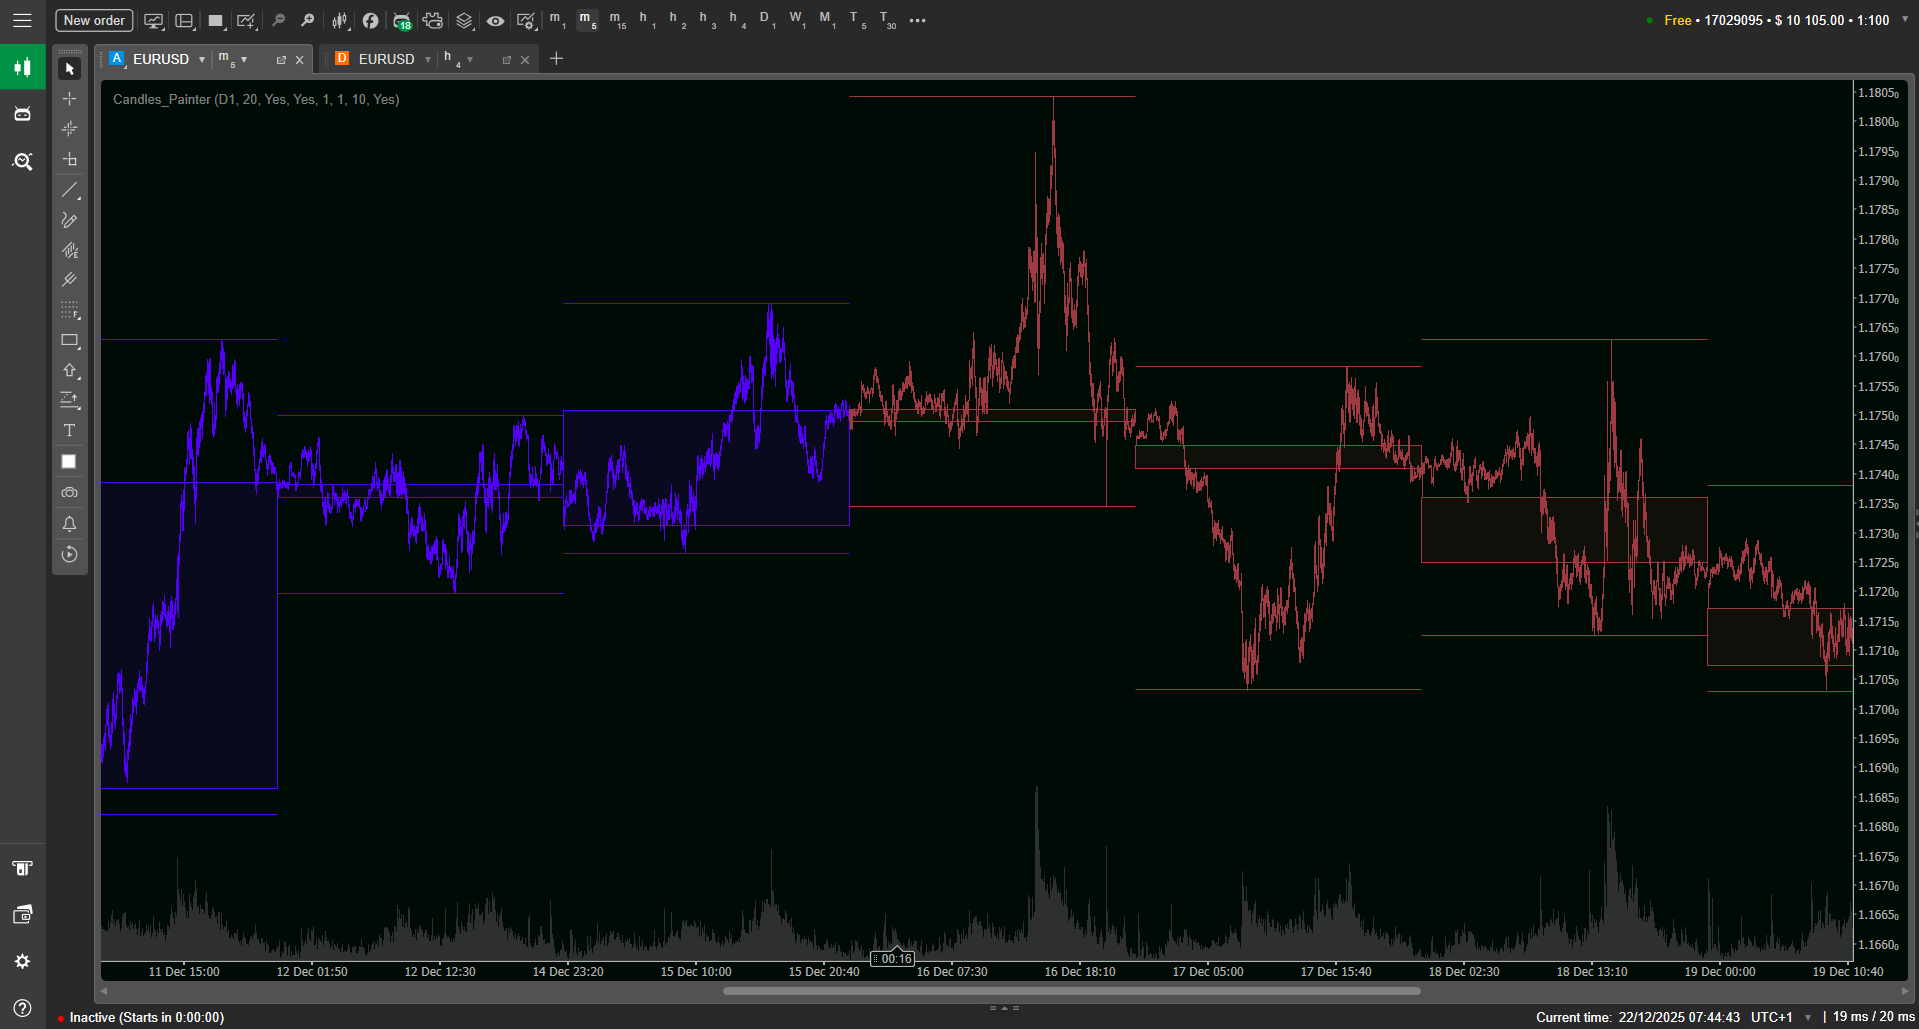
Candles_Painter is a visual “context” tool that keeps you aligned with the higher timeframe while you trade on a lower one. Instead of constantly switching charts (M5 → H1 → H4, etc.), you can keep your execution timeframe open and still see the higher-timeframe bias clearly on the same chart.
At its core, this Candles_Painter cTrader indicator reads a selected Higher Timeframe (HTF) candle and projects that information onto your current chart. It can paint every bar on your current timeframe based on whether the enclosing HTF candle is bullish or bearish, so the “macro direction” is visible at a glance.
To make the HTF structure even clearer, it also draws a filled rectangle for each HTF candle body (Open→Close only, without wicks) and can optionally plot HTF High/Low lines. This gives you a clean overlay that helps you trade with context—without cluttering the chart with extra panels.
Key Features
Multi-timeframe bar painting (HTF bias on every bar)
Candles_Painter can color all bars on your current timeframe according to the direction of the enclosing higher-timeframe candle. If the selected HTF candle is bullish, all lower-timeframe bars inside it can inherit the bullish color; if bearish, they inherit the bearish color. This is especially useful when you want your entries to respect higher-timeframe flow, even while you manage trades on fast charts.
HTF body rectangles (open-to-close overlay without wick clutter)
The indicator draws a filled body rectangle for each higher-timeframe candle using Open-to-Close only. This choice keeps the overlay readable—your eye catches where the HTF candle actually “resolved” (close vs open) instead of being distracted by long wicks. The result is a strong, minimal structure layer that can sit on top of price without hiding it.
Optional HTF High/Low lines for clean range awareness
When enabled, Candles_Painter can draw the High and Low boundaries of each HTF candle with configurable line thickness. This gives you immediate awareness of the larger candle’s range—helpful for understanding whether price is trading in the upper or lower part of the HTF candle and for spotting range breaks or rejections around HTF extremes.
Independent bull/bear styling (bars + rectangles)
You can style bullish and bearish states separately: different colors for current-timeframe bars, and separate outline/fill colors for HTF rectangles. This makes it easy to build a visual language you instantly recognize—e.g., muted fills for HTF bodies, stronger outlines for structure, and distinct bar colors for bias.
Adjustable fill opacity (clarity without blocking price)
HTF rectangles can be semi-transparent using a Fill Opacity percentage (default is a light value). This matters: the overlay should inform you, not cover your candles. With opacity control, you can keep the HTF context visible while preserving clean price reading and other tools (levels, sessions, drawings).
Lookback control + lightweight rendering
You can control how many HTF candles are shown via lookback. This helps keep the chart focused (recent context only) or more historical (to study behavior). The indicator is designed to remain unobtrusive by using native chart objects and keeping visuals simple and fast.
Parameters
Below are the main settings available in Candles_Painter (names may appear exactly as shown here inside cTrader).
Core
Higher Timeframe.— Select the timeframe to overlay (examples: H4, D1, W1).
HTF Lookback (candles) — How many HTF candles to render historically (default shown as 20).
Current TF Bars
Paint Bars by HTF Direction. — Toggle whether current-timeframe bars are recolored to match the enclosing HTF candle direction.
Bull Color / Bear Color— Colors used for the painted current-timeframe bars.
HTF Candle • Common
Draw HTF Rectangles — Toggle HTF body rectangles.
Outline Thickness — Thickness of the HTF body rectangle outline.
Fill Opacity % — Transparency of HTF body fill (default shown as 10%).
Draw HTF High/Low Lines — Toggle HTF High/Low lines.
HL Lines Thickness — Thickness of HTF High/Low lines.
HTF Candle • Bull / Bear styling
Bull Outline Color, Bull Fill Color— Outline and fill for bullish HTF rectangles.
Bear Outline Color, Bear Fill Color— Outline and fill for bearish HTF rectangles.
A practical default is: keep HTF fills subtle (low opacity) and outlines slightly stronger. That way you “feel” the HTF candle bodies without losing the ability to read your execution candles precisely.
Who This Is For
Intraday traders and scalpers who want continuous HTF bias without changing charts every few minutes.
Traders combining higher-timeframe structure with lower-timeframe execution (e.g., SMC/Wyckoff-style context + precision entries).
Trend-followers who want a simple visual filter: “Only take LTF setups when the HTF candle is aligned.”
Discretionary traders who prefer clean charts and want the HTF candle body/range shown without extra indicators.
Anyone who wants a lightweight overlay instead of multiple chart windows and constant timeframe switching.