Overview
Most volume tools show you “how much” traded, but not where it mattered. Side Volume Profile solves that by mapping volume directly onto price levels, so you can instantly spot the prices that attracted the most participation.
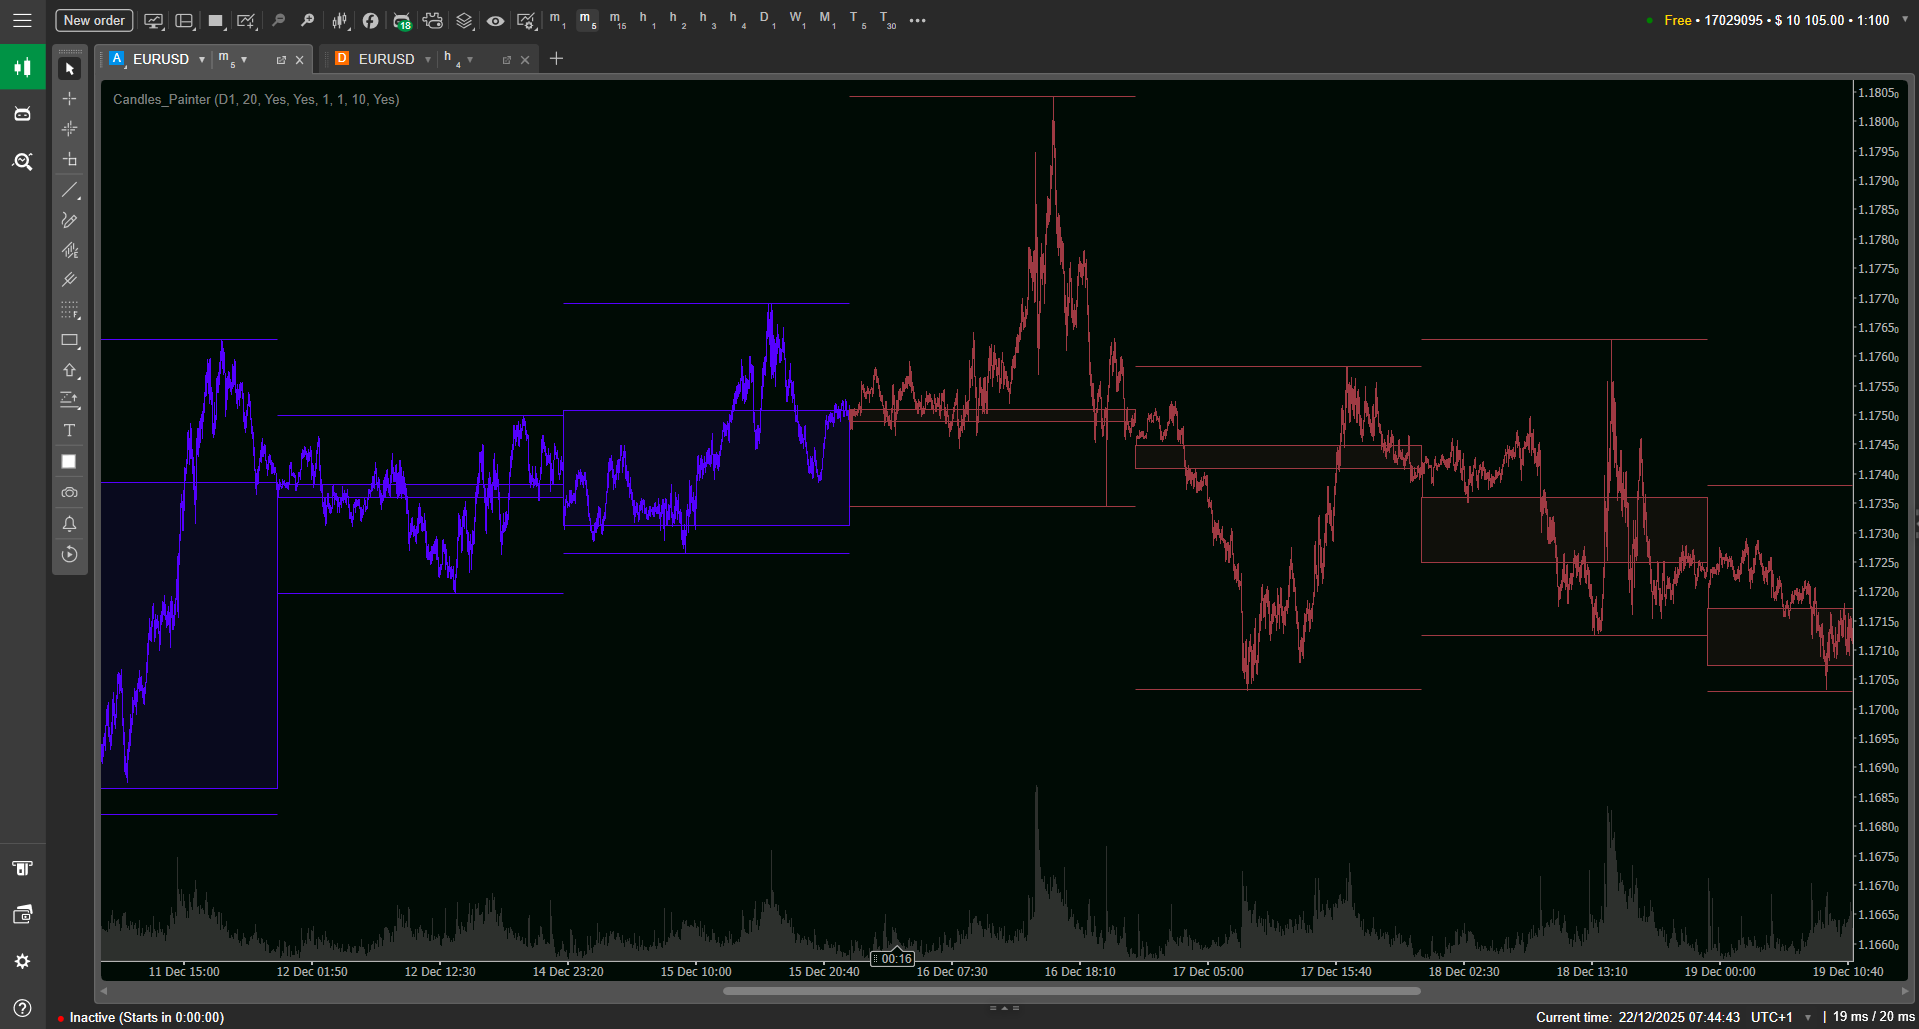
This is a right-side Volume Profile that stays pinned to the latest bars. It doesn’t jump around when you pan the chart, so your context stays stable while you analyze.
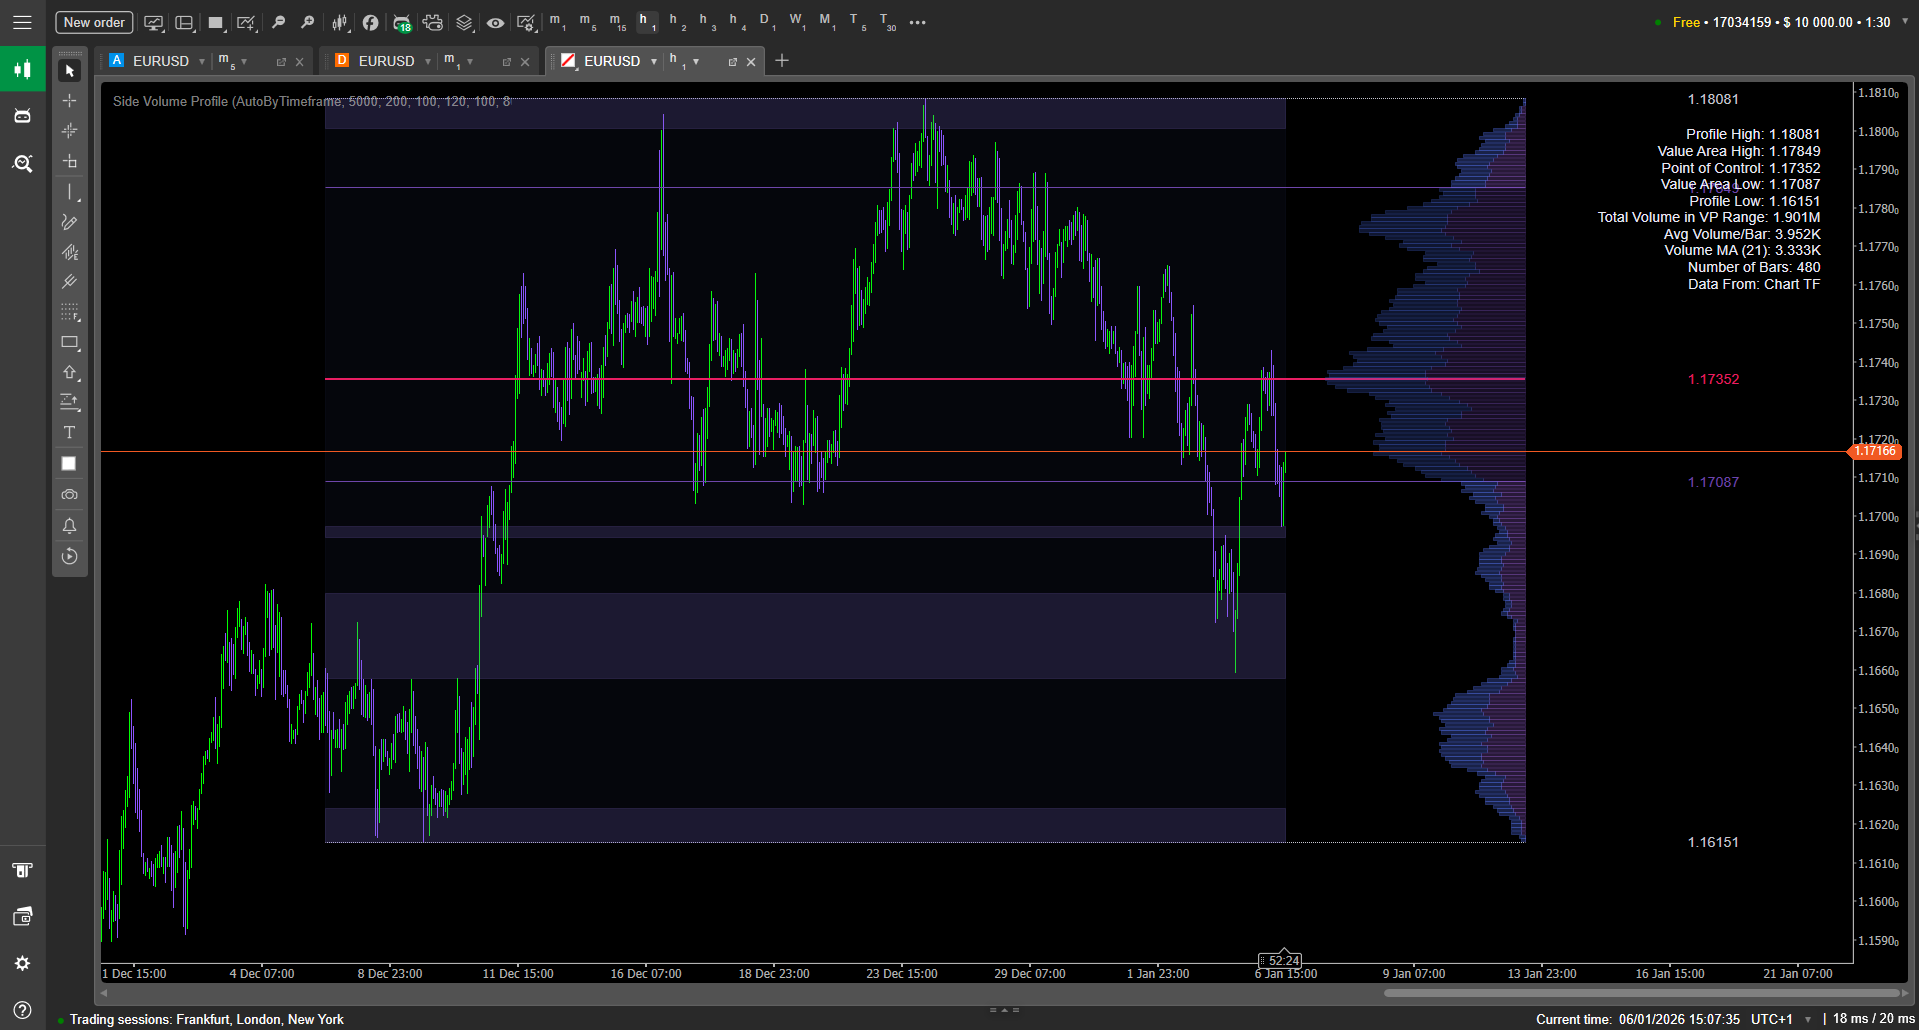
Under the hood, it computes volume-by-price over a chosen range (automatic per timeframe or a fixed number of bars), then draws a clean histogram on the right edge of the chart. Key reference levels like POC, VAH, and VAL are plotted, low-volume zones are highlighted, and optional stats help you read the profile faster.
Key Features
Right-Side Profile That Stays Pinned
Unlike profiles that shift or re-anchor visually when you scroll, Side Volume Profile is designed to remain locked to the newest bars. This keeps your read consistent while you compare structure, reactions, and acceptance around key levels.
Flexible Range Logic: Auto or Fixed Bars
You can compute the profile over a range that adapts automatically to the chart timeframe, or switch to a fixed bar-count mode for tighter control. This makes it practical for both “session-like” reading and quick micro-structure checks.
If you want repeatable analysis (backtesting screenshots, consistent comparisons), FixedBars tends to be the most consistent approach across instruments.
Core Market Profile Levels: POC, VAH, VAL + High/Low
The indicator plots the essential references traders actually use:
POC (Point of Control) — the price with maximum traded volume inside the range
VAH/VAL — value area boundaries based on your chosen Value Area %
Profile High/Low — the range bounds for quick structure anchoring
These levels are easy to style (thickness / line style) so you can match your chart template and quickly differentiate “major” vs “minor” references.
Low-Volume Zone Highlighting (LVZ)
Side Volume Profile can highlight low-volume zones using a threshold based on the max volume row and a minimum zone height in bins/rows.
This is valuable because low-volume areas often behave like “fast lanes”: price may move through them quickly, or react sharply when re-entering them.
“Top Volume” Histogram with EMA Smoothing
Above the profiled range, the indicator can draw a compact volume histogram and apply an EMA smoothing line, with configurable height and an offset (default noted as 10 pips).
This gives you a quick sense of whether activity is expanding or contracting while you evaluate interactions with POC and value boundaries.
Readability-First Visual Control (Palettes + Custom Colors)
The tool includes multiple high-contrast themes and also supports custom colors (with VAH and VAL sharing the same color by design).
Beyond color, you can control bin opacity, profile width scaling, spacing/gaps, and optional background shading for the range—useful if you trade visually and want “at-a-glance” clarity.
Optional Top-Right Stats Panel
A toggleable stats panel can display key info in a compact block, with configurable font size.
This is helpful when you want numbers (levels, range context) visible without constantly hovering or measuring.
Parameters
Below is a practical overview of the settings you’ll typically see/use in Side Volume Profile (names may appear slightly differently in cTrader depending on how your platform displays parameter labels).
Range
Range Mode: AutoByTimeframe or FixedBars
Fixed Bars Count: how many bars are included when using FixedBars
Range Background: show/hide subtle shading behind the analyzed range
Layout & Profile Geometry
Rows (Bins): number of horizontal price rows used to build the profile
Profile Width / Width Scale: controls how wide the histogram extends
Right Offset: distance from the last candle to the profile
Bin Thickness: visual thickness of each histogram row
Label Gap: spacing between labels and the profile
Profile Opacity / Global Bin Opacity: transparency for bins and fills
Value Area & Levels
Value Area %: how much volume is considered “value” (commonly 68–70%)
Show VAH, Show POC, Show VAL: toggles
VAH/POC/VAL Line Width and Line Style: per-level styling
Show Profile High/Low: toggle bounds
High/Low Line Width and Style: styling for bounds
Low-Volume Zones (LVZ)
LVZ Threshold: defined as a % of the maximum row volume
LVZ Minimum Height (Rows): filters out tiny “noise zones”
Show/Highlight LVZ: enable/disable the feature
Top Volume (Histogram + EMA)
EMA Period: smoothing period applied to the top volume histogram
Top Volume Height %: how tall that overlay appears relative to the range
Offset (Pips): vertical placement offset (default mentioned as 10 pips)
Colors, Themes & Panel
Palette/Theme: choose a preset high-contrast palette
Custom Colors: override theme colors (note: VAH = VAL coloring)
Stats Panel: show/hide
Stats Font Size: readability control
Who This Is For
Intraday traders who want clear acceptance vs rejection zones without clutter
Volume-based traders who use POC/VAH/VAL as decision references
Breakout traders who want to identify low-volume “fast zones”
Mean reversion traders looking for structured targets inside value
Traders who prefer stable, pinned visuals while panning/scrolling the chart